

Results of the Questionnaire Survey in the Developments of Selected Towns’ Municipal Housing Stock (2004, 2005)
by Jaroslav Kubečka, of the Ministry of Regional Development,
and Dana Chlupová, Marie Polešáková and Ludmila Rohrerová, of the Institute for Spatial Development
In 2006, the Brno Institute for Spatial Development carried out the 7th questionnaire survey on the development of municipal housing stocks, collecting and upgrading the necessary data and information in selected towns and cities of the Czech Republic. Based on the requirements of the assignor of the research - the Housing Policy Department of the Czech Ministry of Regional Development - this year’s research has taken into consideration the same sample of towns as in 2005. So, addressed was Prague plus some of its districts, the 19 statutory cities (status as per the date of the task submission), and 34 towns - "Map of Addressed Towns". As in previous years, the questionnaire survey was aimed at the exploration of 5 kinds of data which are usually not explored by the Czech Statistic Office: the privatization of the municipal housing stock, shifts within the municipal housing stock, payments for the usage of the municipal housing stock, maintenance costs of the municipal housing stock, and additional data.
The additional part of the questionnaire focused on questions about the rent of municipal dwellings, the related filing system of the demand for municipal dwellings, and the criteria of allowance. Other questions explored methods to decrease the numbers of rent debtors and the amounts of rent and service debts. Also scrutinized was whether indemnity is offered to those who leave their dwellings, whether the private sector participates in the financing of newly built dwellings, and whether Municipalities build dwellings unsubsidized by the state. Also, the respondents could indicate their recommendations as to what the questionnaire should be aimed at next year.
In active participation of the responding municipalities, the research has surveyed a total of 250,260 dwellings, representing 6.5 % of the total of 3,827,678 dwellings of permanent inhabitation in the Czech Republic (2001 census), which approximately means 50 % of all municipal dwellings in the country.
The main objective of the research was to investigate in the actual results of the ongoing privatization of municipal dwellings, started in 1991, till the end of 2005.
Municipal housing stock privatization in selected towns
The development of the privatization, between its start with the transfer of the housing stock from the State to Municipalities in 1991 and 31 December 2005, is shown in Diagram 1, Process of privatization of municipal housing stock in towns/cities under observation, 1991 - 2005.
The Diagram indicates that 46.1 % of all the dwellings transferred to the ownership of the Municipalities were privatized before the end of 2001, 50.9 % of them before the end of 2002, 57.4 % before the end of 2003, 62.6 % before the end of 2004 and 67.0 % before the end of 2005.
The development of the total of municipal dwellings in the towns and cities under observation (including new constructions) between 1991 and 2005 and the supposed situation after the privatization is shown by Diagram 2, Number of municipal dwellings in towns/cities under observation (including newly bulit dwellings) between 1991 and 2005 and expected status after the finalization of the municipal housing stock privatization.
The percentage of the dwellings which the Municipalities intend to keep in their ownership is related to the overall number of dwellings transferred from the State to municipalities in 1991.
Diagram 1
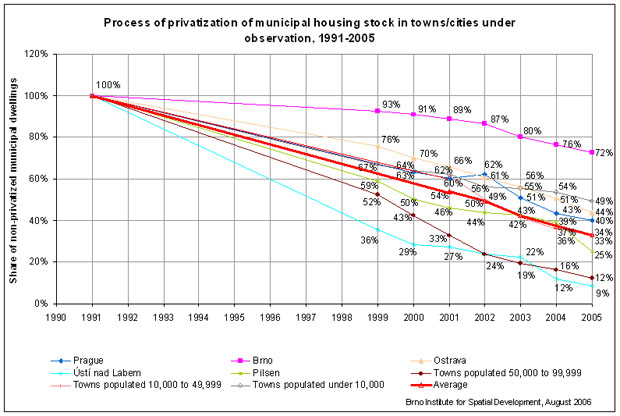
Note: Data on privatization processes in Prague and in Ostrava apply to selected Districts only.
Diagram 2
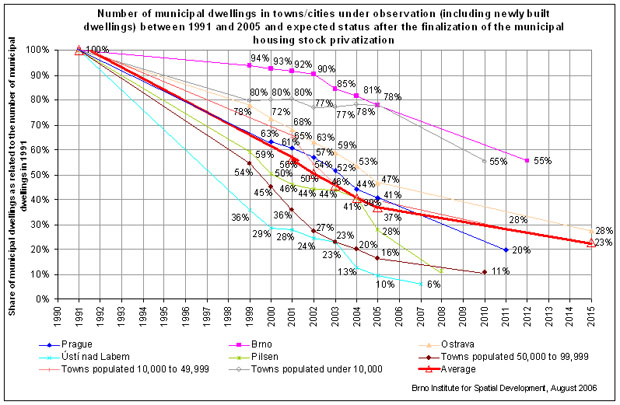
Note: Expected numbers of municipal dwellings after the finalization of the municipal housing stock privatization are specified as per the latest date of the finalisation, as specified by respondents of a given group of towns.
Supposed figures for Prague as in 2011 (as the latest date, mentioned by the District of Prague 7), supposed figures for Brno as in 2012 (as the latest date, mentioned by the Central District), supposed figures for Ostrava as in 2015 (as the latest date, mentioned by the District of Radvanice and Bartovice), supposed figures for Ústí nad Labem as in 2007 (as the latest date, mentioned by the District of Severní Terasa), supposed figures for Pilsen as in 2008 (as the latest date, mentioned by the Municipality for the whole city), supposed figures for towns populated 50,000 to 99,999 as in 2010 (as the latest date, mentioned by Kladno), supposed figures for towns populated 10,000 to 49,999 as in 2011 (as the latest date, mentioned by Hodonín), supposed figures for towns populated under 10,000 as in 2010 (as the latest date, mentioned by Lanškroun, Velká Bíteš, Brtnice and Valtice).
The data on the development of the number of municipal dwellings in Prague and in Ostrava concern only selected city districts.
New constructions
Of the total number of municipal dwellings constructed between 1991 and the end of 2005, 72.0 % were built before the end of 2002, 10.5 % during 2003, 7.5 % during 2004, and 10.0 % during 2005.
Diagram 3, Municipal dwellings completed between 1991 and 31 December 2005 in towns and cities under observation shows the totals of newly constructed dwellings between 1991 and 2005, as per 1000 inhabitants, in Prague, Brno, Ostrava, Ústí nad Labem, Pilsen, and the 3 size categories1) of the rest of towns under observation.
Diagram 3
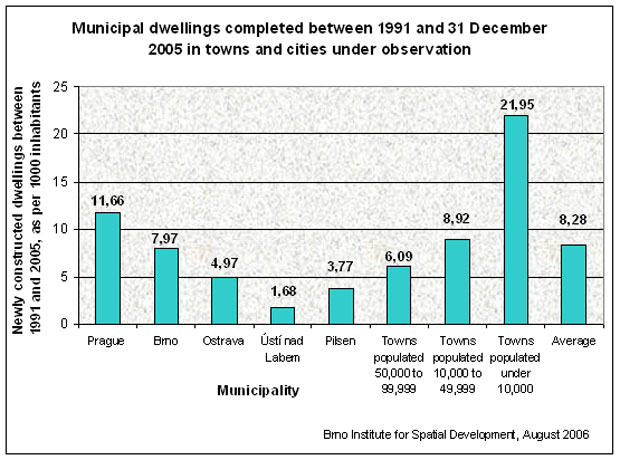
Note: Figures approximate. Some municipalities disregard subsidized dwellings which are more than 50% co-owned by themselves.
The structure of the newly built municipal dwellings is shown in Chart 1, Structure of newly constructed municipal dwellings, completed in 2004 and 2005.
Chart 1
| Municipality | % of newly constructed municipal dwellings, accepted in 2004 | % of newly constructed municipal dwellings, accepted in 2005 | ||
|---|---|---|---|---|
| in newly constructed buildings | in reconstructed buildings | in newly constructed buildings | in reconstructed buildings | |
| Prague | 82 | 18 | 78 | 22 |
| Brno | 92 | 8 | 66 | 34 |
| Ostrava | 40 | 60 | 0 | 100 |
| Ústí nad Labem | 0 | 100 | 0 | 100 |
| Pilsen | 95 | 5 | 99 | 1 |
| Towns populated 50,000 to 99,999 | 81 | 19 | 98 | 2 |
| Towns populated 10,000 to 49,999 | 84 | 16 | 83 | 17 |
| Towns populated under 10,000 | 61 | 39 | 96 | 4 |
| Average | 81 | 19 | 85 | 15 |
Developments of the total of municipal dwellings between 1991 and 2005
Between 1991 and the end of 2001, the total number of municipal dwellings decreased by 43.8 %, between 1991 and the end of 2002 the total number of municipal dwellings decreased by 49.7 %, between 1991 and the end of 2003, the decrease was of 54.5 %. Between 1991 and to the end of 2004, the decrease was of 59.4 % of the total of municipal dwellings, and between 1991 and the end of 2005 the decrease was 63.4 % of the total of municipal dwellings. In the course of 2002, the total number of municipal dwellings decreased by 10.5 %, as related to their number in 2001, in the course of 2003, there was a decrease of 9.5 % as related to 2002, in the course of 2004, the decrease was of 10.8 % as related to 2003, and in the course of 2005, the decrease was 9.9 % as related to 2004.
Estimated termination of the privatization of municipal dwellings
Most respondents have supposed to finish the privatization of municipal dwellings in 2007, 2008, and 2010. The latest of the mentioned terms were 2011 (the town Hodonín and the city of Ostrava’s South District), 2012 (the District of Central Brno), and 2015 (the City District Ostrava - Radvanice and Bartovice). Some respondents still have not fixed their deadlines. 17 respondents have already terminated the privatization, i.e. the City District Prague 9 (1999) has finished stage I, whereas further sales have not been decided yet, the town Most also in 1999, whereas the Mostecká bytová, a.s., which has taken over the housing stock from the town Most as per July 1st, 2002, has not performed the privatization; the town Tišnov has finished a general privatization in 2000, Ostrava’s District of Petřkovice has finished the privatization of municipal dwellings in 2002, the Districts of Prague 8, Prague 13, Ostrava’s District of Polanka nad Odrou and the town of Kyjov in 2003, the Prague District of Horní Počernice in 2004, the same as the City District of Ostrava-Krásné Pole, which has not owned any municipal dwellings any more, the City District Prague 11 in February 2005, whereas now it has been implementing the paid transfers under different rules; in 2005 the privatization has also been finished in the City Districts of Prague 15, Ostrava-Svinov, and in the town Otrokovice; the town Cheb has planned to finish the privatization of the municipal dwellings by the end of 2006; the planned privatization has been finished in the City District of Ústí nad Labem - Neštěmice and now they have been selling individual dwellings in already sold houses; the privatization has also been finished in the towns Teplice and Velké Meziříčí.
The privatization has reached a very advanced stage in Ústí nad Labem where 91 % dwellings have been privatized from the 1991 transfer to the end of 2005. In towns populated 50,000 to 99,999, the privatization reached 88 % of municipal dwellings, in the city Pilsen it is 75 % of dwellings, in towns populated 10,000 to 49,999, 67 %. The capital of Prague has privatized 60 % of dwellings, the city of Ostrava 56 % of dwellings, and the towns under 10,000 inhabitants 51 %. The slowest pace of privatizion is in the city of Brno where mere 28 % of municipal dwellings have been privatized so far.
Share of municipal dwellings as related to all dwellings
The comparison of the numbers of municipal dwellings and the total of dwellings, as given by the censuses of 1991 and 2001, is shown in Diagram 4, Share of municipal dwellings in selected towns in 1991, 2004 and 2005.
The share of municipal dwellings is gradually decreasing. In 1991, 39.3 % of all dwellings were municipal. In 2003, 17.3 % were municipal, in 2004, 15.8 %, and in 2005, 14.3 %.
Diagram 4
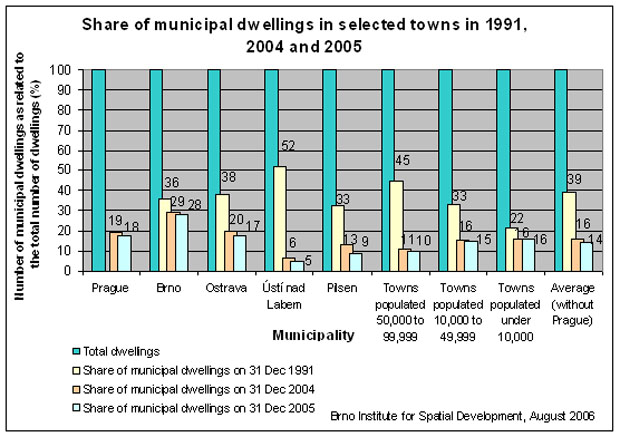
Note: Numbers of municipal dwellings in 1991 were compared to totals of dwellings as per the 1991 census. Numbers of municipal dwellings in 2004 and 2005 were compared to totals of dwellings as per the 2001 census.
Numbers of dwellings the Municipalities intend to keep in their ownership
The Municipalities intend to hold in their ownership 22.6 % of the dwellings (as related to those transferred to their ownership in 1991).
As related to the number of dwellings the Municipalities owned as per 31 December 2005, they intend to keep 61.7 % of the dwellings (the number of dwellings the Municipalities owned as per 31 December 2005 is the sum of those dwellings that remained, to the Municipalities, after the privatization of the housing stock transferred to them in 1991 and of newly built municipal dwellings).
General comments on the results of the municipal housing stock privatization
- In most towns, there was large demand for the privatization of the housing stock, sometimes very intensively so. The cities of Prague, Ústí nad Labem, and Pilsen is where the demand is reported the largest. Unwanted is the privatization in the City Districts of Prague 5, Brno - Tuřany, and Ostrava - Polanka nad Odrou (these are City Districts with only a negligible number of municipal dwellings).
- Mostly used as technical documentation in the process of housing stock privatization is the house passport and the revision reports (such as for electricity, elevators, heating units, fire protection, and so forth). If available, the planning documentation of the building is used too.
- Technical conditions of the house seldom make difference in the statements of the Municipalities or, if they do, privatization of buildings in worse technical conditions is preferred. Just the towns of Dačice and Zruč nad Sázavou and the City District Ostrava - Hošťálkovice say they have been privatizing buildings in good technical conditions. The City District Ostrava - Hrabová privatizes both houses in good technical conditions and houses in good technical conditions after rehabilitation. The town Tábor sells houses in good technical conditions to their tenants, whereas vacant houses are sold, featuring worse technical conditions. The City District Prague - Řepy has reported that buildings in good technical conditions are privatized but, at the same time, they stated no difference was made. The City District Ústí nad Labem - Neštěmice privatizes buildings in good technical conditions and the town Svitavy buildings in good technical conditions after rehabilitation, however, the both respondents privatize houses in worse technical conditions, too. This may also indicate that both of the last respondents do not distinguish the conditions at all. As regards the town Svitavy, it is probable that the town tries, within its capabilities, to rehabilitate at least some houses prior to their privatization.
- The respondents’ answers indicate that if the tenants show lack of demand for the municipal flat or house they live in, the dwellings are often offered and sold to third parties, sometimes under various limitations such as the tenant’s approval (in Písek) or, as in Jihlava, only debtors’ dwellings in sold buildings are offered to third parties. The City District Ostrava - Vítkovice has stated they have been selling only the debtor’s dwellings. In some places they only start contemplating such procedures.
Housing policy concepts
- By its Resolution No. 19/12 of June 24th, 2004, the Municipality of Prague has designed and acclaimed the Concept of the housing policy for 2004 and the oncoming period, with unspecified duration of the document.
- The Municipality of Brno has designed its Housing strategy. The document was acclaimed in 2001 to be valid till 2011.
- The Municipality of Ostrava is currently designing the Concept of the housing policy.
- The Districts of Ústí nad Labem have not designed any concept of the housing policy yet, nor is any document of such kind being prepared.
- The Municipality of Pilsen has designed the Amendment and new directions of the housing policy, in force since 1999, of unspecified validity.
- Of other 21 towns and cities, i.e. 43 %, have designed and acclaimed their housing concepts or other documents, independent or as parts of other documents (Olomouc, Liberec, Havířov, Zlín, Kladno, Karviná, Děčín, Chomutov, Jablonec nad Nisou, Tábor, Cheb, Hodonín, Uherské Hradiště, Svitavy, Český Krumlov, Znojmo, Písek, Přerov, Polička, Zruč nad Sázavou, and Brtnice). Two other towns, i.e. 4 %, have only been working on preparation of their documents (České Budějovice and Lanškroun). 19 other towns, i.e. 39 %, have not had such a document and have not been preparing it at all (Opava, Frýdek-Místek, Karlovy Vary, Teplice, Jihlava, Mladá Boleslav, Česká Lípa, Třinec, Příbram, Otrokovice, Kyjov, Velké Meziříčí, Broumov, Tišnov, Dačice, Holice, Velká Bíteš, Valtice, and Kdyně). Four respondents, i.e. 8 %, have not responded to this question (Pardubice, Prostějov, Třebíč, and Kroměříž). Two towns, i.e. 4 %, have not delivered the questionnaire (Hradec Králové, upon mutual agreement, and Vodňany). The city of Most, representing the remaining 2 %, has transferred a major part of the housing stock to a corporation operating according to annual business plans, while the Municipality’s focus is on the support to those who build houses on their own (plot sales, network construction).
Reactions to the newly included questions this year, about how the accession of the Czech Republic to the EU, in May 2004, and the following necessity to adhere to the Community law in the field of public support, influenced the housing stock privatization process.
The respondents (115 respondents who have returned filled questionnaires) have responded to the question whether the accession of the Czech Republic to the EU, in May 2004, and the following necessity to adhere to the Community law in the field of public subsidy, influenced the housing stock privatization process in their municipality, as follows:
- 46 % stated that this fact did not influence the process of the housing stock privatization in their municipality on the instant. Out of which 91 % stated it was not necessary to apply any change and 9 % stated this fact did not influence the privatization on the instant; however, they were preparing a change of the existing conditions.
- 21 % stated that this fact influenced the privatization process. Out of which 24 % stated the privatization was discontinued, however, conditions were modified so that they would comply with the EU law in the field of public subsidy. 38 % stated the privatization was under way only in the form of the sale of individual dwellings to natural persons who were living in such dwellings. 19 % stated the privatization was discontinued, but only after verification of conditions (in the Economic Competition Protection Authority) and they were preparing a change of the conditions. 10 % stated the privatization was totally suspended; 5 % stated the privatization was suspended and where municipal dwellings would be privatized, then only for a market price. 5 % stated the privatization was under way only in the form of the sale of individual dwellings to natural persons who were living in such dwellings and, at the same time, the privatization was discontinued, but only after verification of conditions (in the Economic Competition Protection Authority) and they were preparing a change of the conditions.
- 14 % of respondents did not respond to this question.
- 14 % of respondents suspended the privatization or did not privatize in the respective year.
- 5 % of respondents referred to a relevant town council in this matter.
- 1 % did not have the intention to privatize.
The respondents utilize the following methods how to prevent the risk of providing prohibited public subsidy:
- 28 % sell dwellings only to natural persons, ranking among the tenants, in compliance with the 72/1994 Statute, On the Ownership of Dwellings, as last amended;
- 3 % sell houses to legal entities for market price;
- 7 % sell houses to legal entities for such a price so as the difference between a market and real sale price of a house would not exceed the “de minimis” limit within three years;
- 2 % sell houses to co-operatives, consisting of tenants, that transfer the dwellings to the ownership of individual users on instant, and dissolve themselves (these are target based co-operatives as mediators of the sale of dwellings);
- 8 % use other procedures, for example the sale of dwellings in the form of competitive bidding or public auction (some respondents use these sales methods only for selected dwelling categories, unoccupied or dislodged flats to be as example);
- 14 % did not respond to this question;
- 16 % suspended the privatization or did not privatize in the respective year;
- 6 % of the respondents refer to a relevant town council in this matter;
- 1 % the Town Council refers to relevant City Districts;
- 16 % of the respondents use two or more above specified methods at the same time.
Out of the total number of 115 respondents, who have returned a filled questionnaire, 17 % consulted the issue of compliance, with the Community law, of a provided public subsidy with the Economic Competition Protection Authority; 62 % did not consult this issue, 3 % stated they had not been privatizing any more (and therefore did not consult this issue); 14 % did not respond to this question; 4 % referred to relevant Town Councils in this issue; and 1 % did not intend to privatize.
Results from the viewpoint of shifts within the housing stock, of payments for the use of the stock, and of maintenance costs, in selected towns
The results of the research in the shifts within the housing stock show that situations in larger cities (Prague, Brno, Ostrava, Ústí nad Labem, Pilsen) and smaller towns are not very different. The movements are rather insignificant, at an average of below 3 % of the total number of municipal dwellings. Such situation may be considered typical for the whole country.
- The average number of households having exchanged their municipal apartments in 2004 was 1.4 % of the total of municipal dwellings, while in 2005, 1.4 % as well.
- The average number of rent transfers of municipal flats was 2.1 % of the total of municipal dwellings in 2004, while in 2005, 1.9 %.
- The average number of newly “allowed” municipal apartments in new, vacant, or cleared dwellings was 2.7 % of the total of municipal dwellings in 2004, while in 2005, 3.1 %.
- The average of legally evicted apartments as by 31 December 2004 was 1.2 % of the total of municipal dwellings, while as by 31 December 2005, 1.3 %.
- The average number of legal notices to quit the apartment was 1.2 % of the total of municipal dwellings in 2004, while in 2005, 1.2 % as well. Legal executions due to debts in rentals and/or services were at mere tenths of percent (0.4 to 0.6) of the total number of municipal dwellings.
The development of the numbers of debtors in rentals and/or services between 2001 and 2005 is shown in Diagram 5, Development of the number of debtors (in rentals and/or services) in municipal dwellings between 2001 and 2005 (2000 = 100 %). The development between the years 2000 and 2005 shows that the numbers of debtors was decreasing in the specified period of time, but in 2005 this trend stopped in some towns/cities; in Brno, Ostrava, and in towns populated between 10,000 and 49,999 the number of debtors increased in 2005, as compared to 2004. On the other hand, the most significant decrease of the number of debtors occurred in Prague.
The share of debtors related to the total number of municipal dwellings oscillate between 20 and 30 % in 2005 (same as in 2004). It is only towns of under 10,000 inhabitants where the average rate of debtors is some 10 %.2)
Diagram 6, Development of municipal dwellings and debtors in towns/cities under observation between 2000 and 2005 (towns populated under 10,000 exclusive) shows the relation between development of the number of debtors and the development of the number of municipal dwellings in the towns under observation between 2000 and 2005. It is clear from the diagram that, within the specified period of time, the number of municipal dwellings and the number of debtors was decreasing approximately at the same pace, whereas before 2002 the decrease of the number of debtors was only gentle, while in 2003 the pace of decrease of the number of debtors significantly accelerated and caught up with the pace of decrease of the number of municipal dwellings. The situation in individual towns differs. The number of debtors, as compared to the number of municipal dwellings, is decreasing more rapidly in Prague and in Pilsen, while it is slower in Brno, Ostrava, and in towns populated between 10,000 and 49,999. In the towns/cities populated between 50,000 and 99,999 the number of debtors was increasing before 2002, while then its significant decrease started and in 2004 the decrease of the number of debtors caught up with the decrease of the number of municipal dwellings.
The number of debtors in the municipal dwellings, in relation to the overall number of dwellings in the towns/cities under observation as per 31 December 2004, is given in the Diagram 7, Number of debtors in municipal dwellings as related to the total number of dwellings as per 31 December 2004. The same data as per 31 December 2005 are given in the Diagram 8, Number of debtors in municipal dwellings as related to the total number of dwellings as per 31 December 2005.
Diagram 5
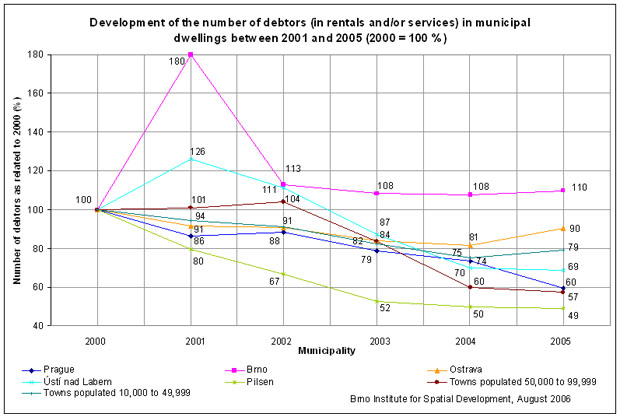
Note: Data on debtors in Prague, Brno, and Ústí nad Labem apply to selected Districts only. Data on debtors in Ostrava apply to the whole of the city except those registered at the Municipal Office.
Diagram 6
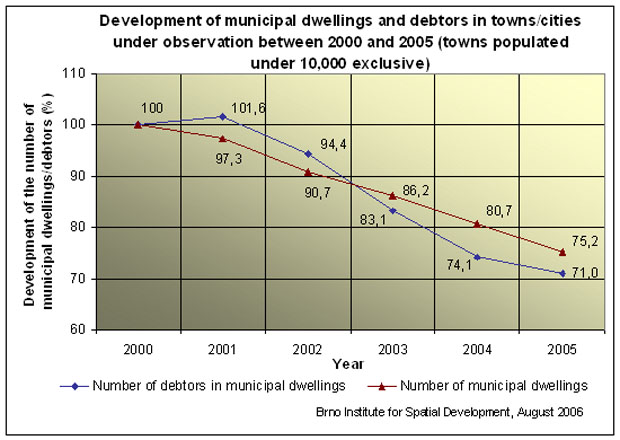
Diagram 7
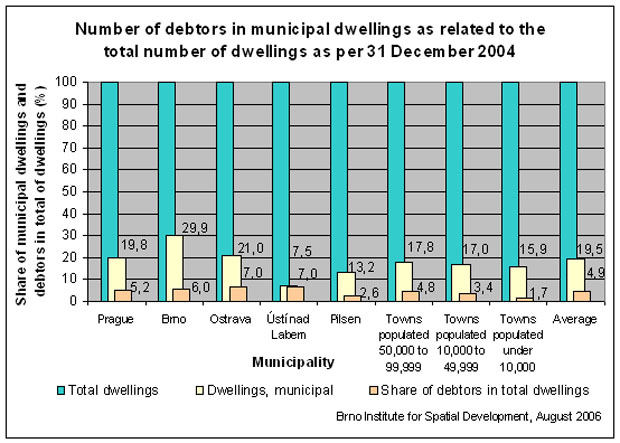
Diagram 8
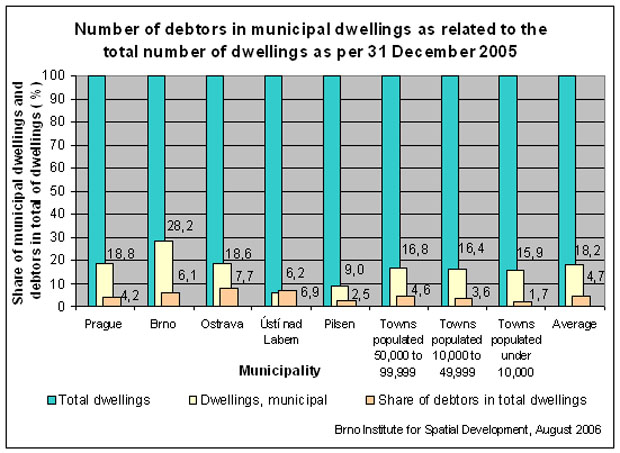
Note: Data on total dwellings, total municipal dwellings, and debtors in Prague, Brno, Ostrava, and Ústí nad Labem apply to selected Districts only. Data on total dwellings as per the census of 1 March 2001.
The question of the numbers of debtors (in rentals and/or services) who owed payments for the months of November and December of respective years was answered by a few respondents only, as the most frequent system of evidence cannot easily identify short-term debts in specific months. The data in following Chart 2, Share of debtors in November and December of respective years, related to the overall number of debtors, are therefore rather approximate. Not the arithmetic average but the median is shown here, the latter being more explanatory with the small batch of respondents.
Chart 2
| Municipality | 2004 | 2005 | ||||
|---|---|---|---|---|---|---|
| Min | Max | Median | Min | Max | Median | |
| Prague (selected city Districts) | 1,4 % | 61,8 % | 27,5 % | 5,0 % | 41,6 % | 31,1 % |
| Brno (selected city Districts) | 4,9 % | 100,0 % | 42,0 % | 0,0 % | 81,6 % | 35,9 % |
| Ostrava (selected city Districts) | 0,0 % | 100,0 % | 33,3 % | 0,0 % | 100,0 % | 19,9 % |
| Ústí nad Labem (selected city Districts) | 0,9 % | 44,9 % | 7,8 % | 2,6 % | 53,1 % | 6,8 % |
| Pilsen (selected city Districts) | 28,6 % | 47,6 % | 38,1 % | 28,6 % | 40,9 % | 34,7 % |
| Towns populated 50,000 to 99,999 | 16,1 % | 45,8 % | 29,4 % | 9,5 % | 52,2 % | 30,1 % |
| Towns populated 10,000 to 49,999 | 1,6 % | 78,6 % | 29,4 % | 0,2 % | 60,9 % | 21,2 % |
| Towns populated under 10,000 | 8,1 % | 62,5 % | 31,1 % | 4,2 % | 71,4 % | 29,7 % |
The average net rental per dwelling in 2004 was of CZK 1,682 a month, while in 2005, CZK 1,649 a month.
The average monthly payment for services per dwelling in 2004 was of CZK 1,600, while in 2005, CZK 1,621.
So, the average monthly payment for the use of a municipal apartment was of CZK 3,282 in 2004, while in 2005, of CZK 3,271.
Thus the 2005 payments for the average net rental were slightly lower than those of 2004, whereas the average payment for services slightly increased. As a result, the total payment for the use of an apartment decreased, though this decrease is not so significant.
The average debt on the net rental of a municipal apartment was of CZK 2,835 as by 31 December 2004, while of CZK 2,857 as by 31 December 2005.
The average debt on services in a municipal apartment was of CZK 2,590 as by 31 December 2004, while of CZK 2,816 as by 31 December 2005.
So, the average debt on the use of a municipal apartment was of CZK 5,425 as by 31 December 2004, while of CZK 5,673 as by 31 December 2005.
Thus the 2005 debts for both the net rental and services were higher than those of 2004. Such increase may partly be caused by the decrease in the number of municipal dwellings due to the privatization of the housing stock.
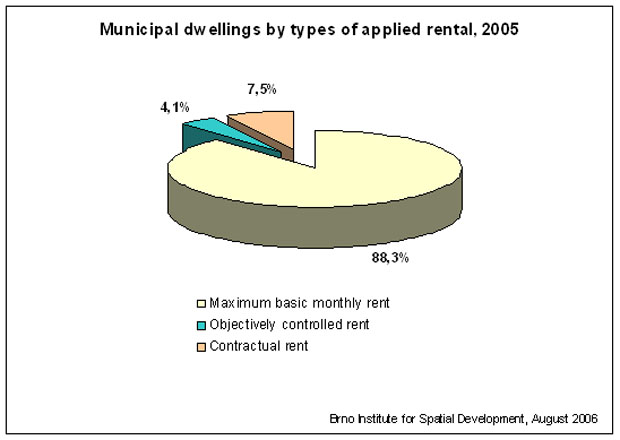
The percentages of municipal dwellings for which the maximum basic rent (as determined by the Ministry of Finance), the objectively controlled rent, or the contractual rent are applied, is shown in Diagram 9, Municipal dwellings by types of applied rental, 2004 and Diagram 10, Municipal dwellings by types of applied rental, 2005.
The Diagrams indicate that the shares of objectively controlled and contractual rents keep increasing, while the share of the maximum basic monthly rent is decreasing.
The share of the dwellings with the maximum basic monthly rent in the towns under observation was 90.6 % in 2004 and 88.3 % in 2005.
The share of the objectively controlled rent was 3.2 % in 2004 and 4.1 % in 2005. Significantly higher is the share of this type for towns populated under 10,000: 13.8 % in 2004 and 13.7 % in 2005.
The share of the contractual rent was 6.2 % in 2004 and 7.5 % in 2005. Most contractually rented flats are found in the towns of 50,000 to 99,999 inhabitants (11.3 % in 2004 and 13.5 % in 2005). As well, the share of contractual rent dwellings exceeded the 10 % value in Pilsen (10.3 %) and in Ostrava (10.2 %) in 2005.
Diagram 9
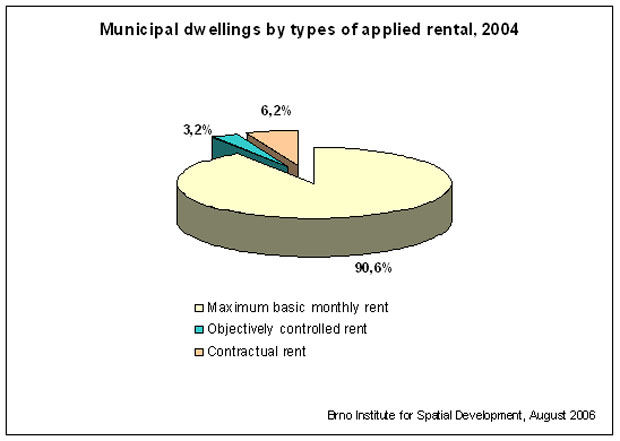
Diagram 10
In most cases, municipalities manage their housing stock through one or more specialized private businesses, hired by the municipality, entitled to a consideration for the management (where a Town Council is responsible for the whole of a city, several caretakers, entitled to a consideration for the management, are usually mentioned, while where a City District is responsible, one private business as caretaker, entitled to a consideration for the management, is usually mentioned). In 2004, such type of care-taking was with 53.8 % of the total of municipal dwellings, while in 2005, 49.8 %.
The average monthly costs of the management of a municipal dwelling through a caretaker were of CZK 203 in 2004, while of CZK 200 in 2005. The average costs for dwellings maintained directly by one of the Municipality’s departments were of CZK 132 in 2004, while of CZK 129 in 2005. The mean costs of the management of the municipal dwellings slightly decreased as for the both types of management in 2005, compared to 2004. The limitation of the management costs growth, or even their decrease, is a positive trend. One of the reasons for the decrease may be that the towns/cities have already sold the remaining apartments in already sooner privatized houses where a town/city was one of the members of a partnership of owners (the management of single apartments in privatized houses is very costly for the towns/cities).
The average monthly costs of the management of municipal dwellings decreased in 2005, compared to 2004, while the average income from rentals of municipal dwellings increased in 2005, compared to 2004, which is possibly related to the continuing privatization of the municipal housing stock where many towns/cities dispose of the housing stock with bad technical conditions (the average monthly management and maintenance costs of a municipal dwelling were CZK 1,692 in 2004, while CZK 1,520 were in question in 2005; the average monthly income from rentals of municipal dwellings was CZK 1,767 in 2004, while the amount of CZK 1,806 was in question in 2005). The average costs of management and maintenance of municipal dwellings was lower than the average incomes from the rentals of municipal dwellings in both 2004 and 2005, whereas the difference between these two amounts increased in 2005, compared to 2004.
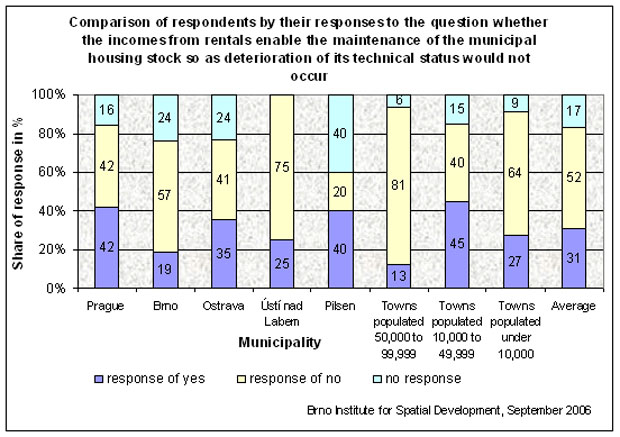
Diagrams 11a and 11b, Comparison of respondents by their responses to the question whether the incomes from rentals enable the maintenance of the municipal housing stock so as deterioration of its technical status would not occur, show the evaluation of the responses of individual respondents to this question.
Diagram 11a
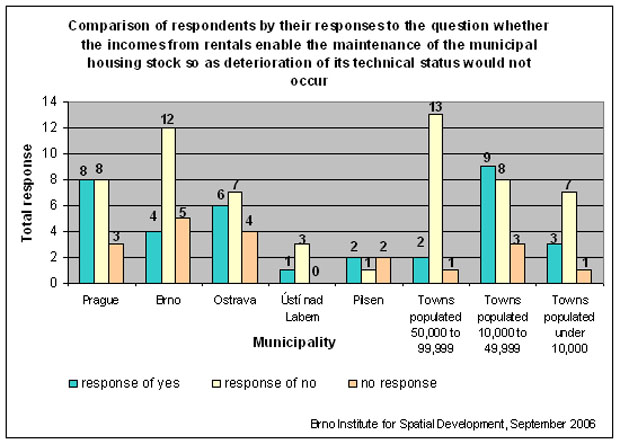
Diagram 11b
Selected facts from the additional part of the questionnaire
- Of all the 118 respondents, only 13 (i.e. 11 %) do not file applications for the allowance of municipal apartments. These are the Municipality of Brno, the City Districts of Brno - Tuřany, Moravská Ostrava and Přívoz, and Stará Bělá in Ostrava, Ústí nad Labem - Severní Terasa and Central District of Ústí nad Labem, and the Municipalities of Pardubice, Teplice, Kladno, Tábor, Příbram, Lanškroun, and Dačice. (Of these, two respondents own very few apartments: Tuřany [Brno] 6 apartments and Stará Bělá [Ostrava] 21.) The other respondents keep their records, some of them filing certain types of apartments only, such as those of special purpose, those in buildings of special purpose, or those serving to public benefit.
- The percentage of registered applications for municipal dwellings in 2004 and 2005 in all the categories of towns and cities, as related to total numbers of municipal dwellings, and such percentage in total, is shown in Diagram 12, Share of registered applications for municipal dwellings as related to total numbers of municipal dwellings, 2004 and 2005.
- The percentage of registered applications for municipal dwellings in 2004 and 2005 in all the categories of towns and cities, as related to total numbers of all dwellings (as per the 2001 census), and such percentage in total, is shown in Diagram 13, Number of registered applications for municipal dwellings as related to total numbers of all dwellings in towns and cities under observation, 2004 and 2005.
Diagram 12
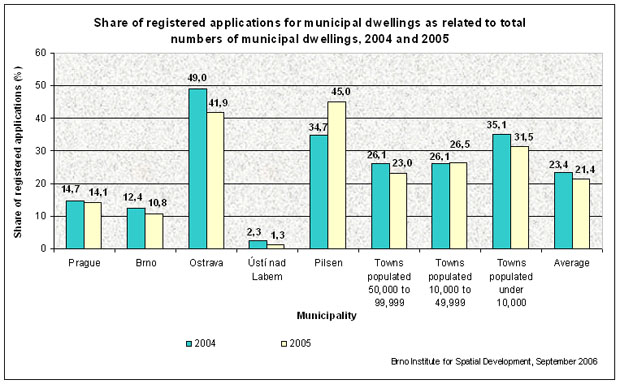
Note: Figures of Prague, Brno, Ostrava, and Ústí nad Labem apply to selected city Districts.
Diagram 13
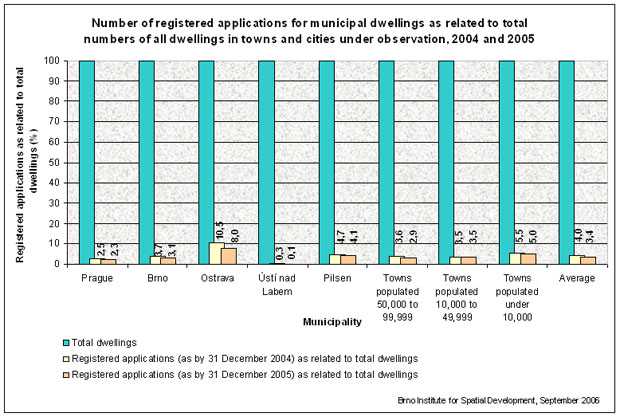
Note: Figures of Prague, Brno, Ostrava and Ústí nad Labem apply to selected city Districts.
- Three respondents (the towns Česká Lípa and Cheb, and the City District Prague 11) specified they provided compensation money in the event the tenants returned a vacant flat.
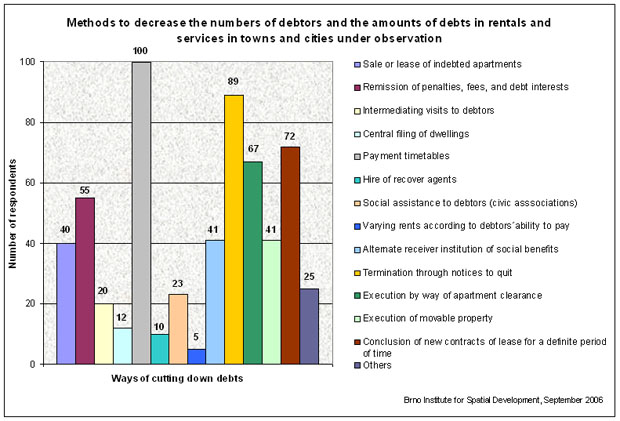
- Ways to decrease the numbers of debtors and the amounts of debts in rentals and services, in a comprehensive summary for all the respondents, are shown in Diagram 14, Methods to decrease the numbers of debtors and the amounts of debts in rentals and services in towns and cities under observation.
Diagram 14
The issues of municipal housing have been monitored through questionnaire surveys since 2000, then exploring data of 1998 and 1999. The 2001 survey explored data of 1999 and 2000, the 2002 survey did so for 2000 and 2001, in 2003 the situation in the years 2001 and 2002 was mapped, the last year’s survey pursued the development in the years 2003 and 2004 and this year’s survey was focused on 2004 and 2005. For the assignor of the task - the Ministry of Regional Development’s Department of Housing Policy - such research is one of the ways to collect up-to-date information on municipal housing, for the Czech Statistic Office does not record such data.
The research of the developments in the privatization of the municipal housing stock offers the comparison of the dynamics of this process between its beginnings in 1991 and today, giving estimations of its prospects. The results of this year’s research, i.e. for 2005, show again that the termination of the process of the municipal housing stock privatization must be postponed. The most remote dates mentioned in this year’s research were 2011, 2012, and 2015.
The printed version of the final report of the 2006 questionnaire survey is available at the Housing Policy Department of the Ministry of Regional Development and at the Brno Institute for Spatial Development. Brief results of the research of the developments in municipal housing stocks in 2004 and 2005 are available on the Institute’s web site, www.uur.cz.
Following the requirements of the Ministry of Regional Development, the survey will be repeated at the beginning of 2007 with the questionnaire updated according to the assignor’s comments.
The task of Monitoring Municipal Housing, comprehensively analysing the municipal housing stock, is an important part of the continuous activities of the Institute for Spatial Development. The results of the annually repeated research are widely used by housing policy makers.
The assignor of the task - the Housing Policy Department of the Ministry of Regional Development - and the researching staff of the Institute for Spatial Development wish to thank all the respondents for their collaborative approach and the information with which they have contributed to the final report, making thus a coherent picture of the situation of the municipal housing stock in the Czech Republic.
Notes
- 1) By the 30/1995 Regulation of the Ministry of Finance, amending the 176/1993 Regulation on Rentals.
- 2) There was a significantly higher percentage of debtors (111 %) in Ústí nad Labem. The high share of debtors in this town is caused by the advanced privatization stage where the substantial decrease of the number of municipal dwellings was accompanied by a less significant decrease of the number of debtors. Compared to 2003, in 2004, the number of debtors in the Districts under observation (evaluated without the city district Severní Terasa) strongly increased in relation to the overall number of municipal dwellings (ca 30 %). Compared to 2004, in 2005, another increase of the number of debtors, as related to the overall number of municipal dwellings, was observed (by more 18 %). The increase of the share of debtors in 2004 was due to the substantial decrease of the number of dwellings in the Central District. Namely, the municipal housing stock was privatized here, but the number of debtors was decreasing at a much slower pace. In 2005, another decrease of the number of dwellings was recorded in the Central District, having been reduced to one half as compared to 2004, and, at the same time, a slight increase of the number of debtors was recorded. (Note: Many apartments, including those privatized, are burdened with one or more claims after previous tenants. Such fact may importantly distort the actual percentage of debtors as related to the total number of municipal dwellings. The Central District declares to own 410 municipal flats on 31 December 2004 with 1,106 debtors including old claims. After a telephone request, this was completed with the data for 2004 without the old claims. In particular, there were 103 debtors in relation to 410 municipal dwellings, representing 25.1 %.)